North American Digital Engagement: A Comparative Analysis of U.S. Cannabis Subreddits (Q4 2025 – Q2 2026)
While Bud Trendz remains firmly rooted in the Canadian landscape, our team has been tracking several key U.S. jurisdictions to benchmark how digital cannabis communities evolve in different regulatory environments. This cross-border project provides a unique data-driven perspective on daily distinct post titles (orange) and unique author counts (blue) from November 2025 through early April 2026.

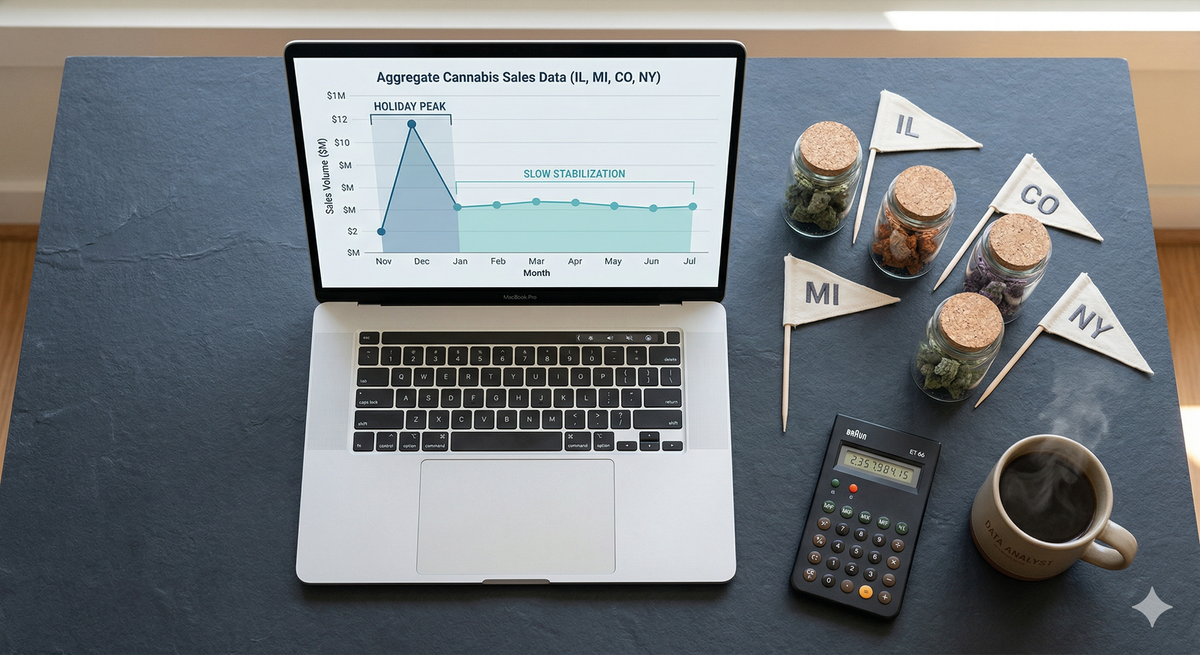
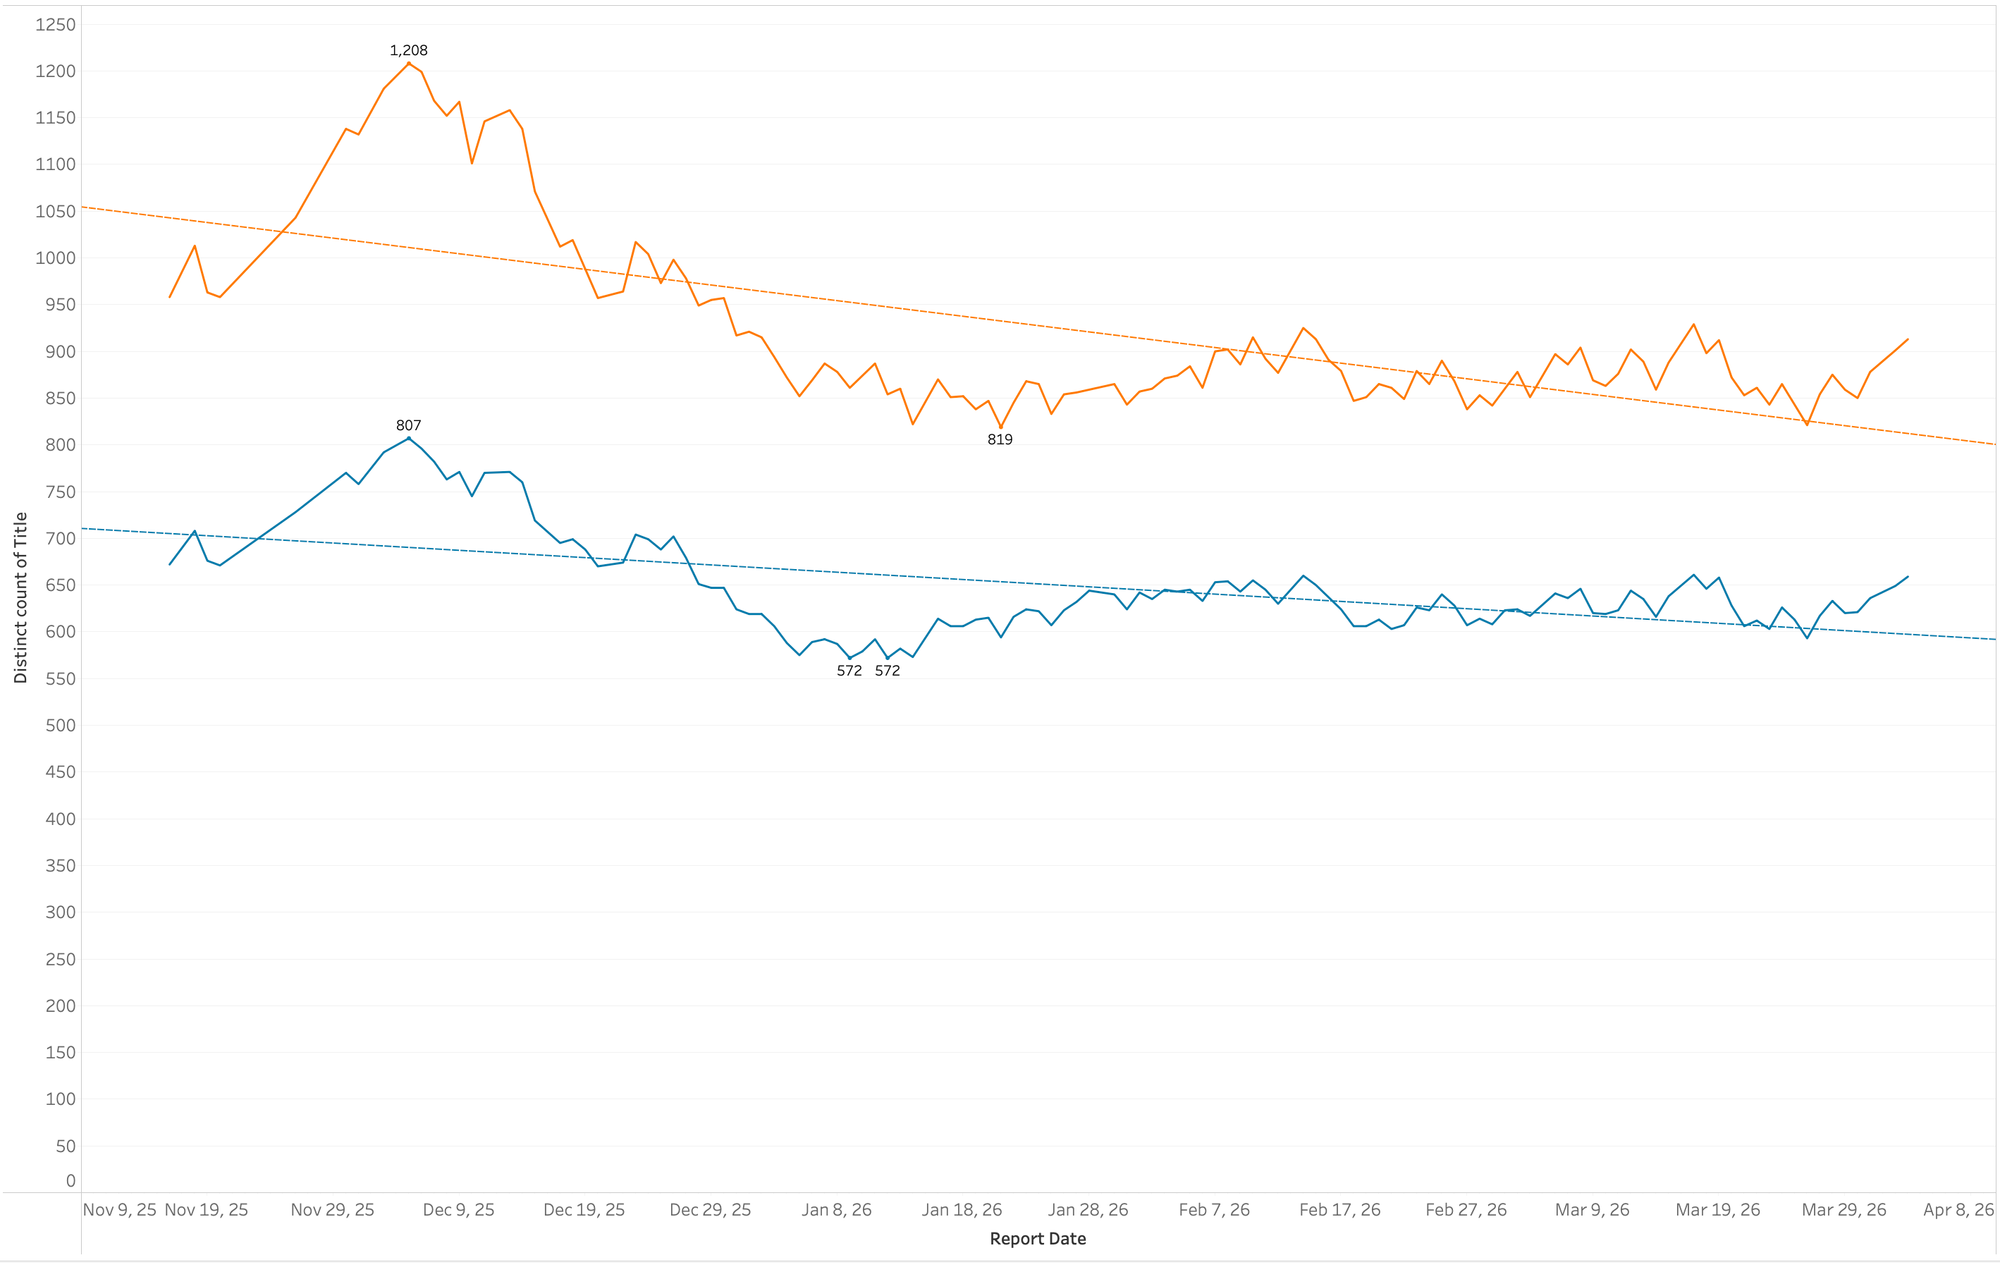
Aggregate Network Trends (Total Data)
The consolidated data for the tracked U.S. subreddits reveals a high degree of seasonal correlation. Total network activity reached a significant peak on December 8, 2025, with 1,208 unique authors contributing 807 distinct posts in a single 24-hour period. This holiday-driven surge was followed by a systemic "January Slump," with engagement reaching a local floor between January 8 and January 15, 2026, bottoming out at 572 unique authors. Since that mid-winter dip, the general trend line has stabilized. As of April 2026, the daily baseline sits at approximately 850 to 900 unique authors, suggesting a resilient and consistent community following the post-holiday correction.
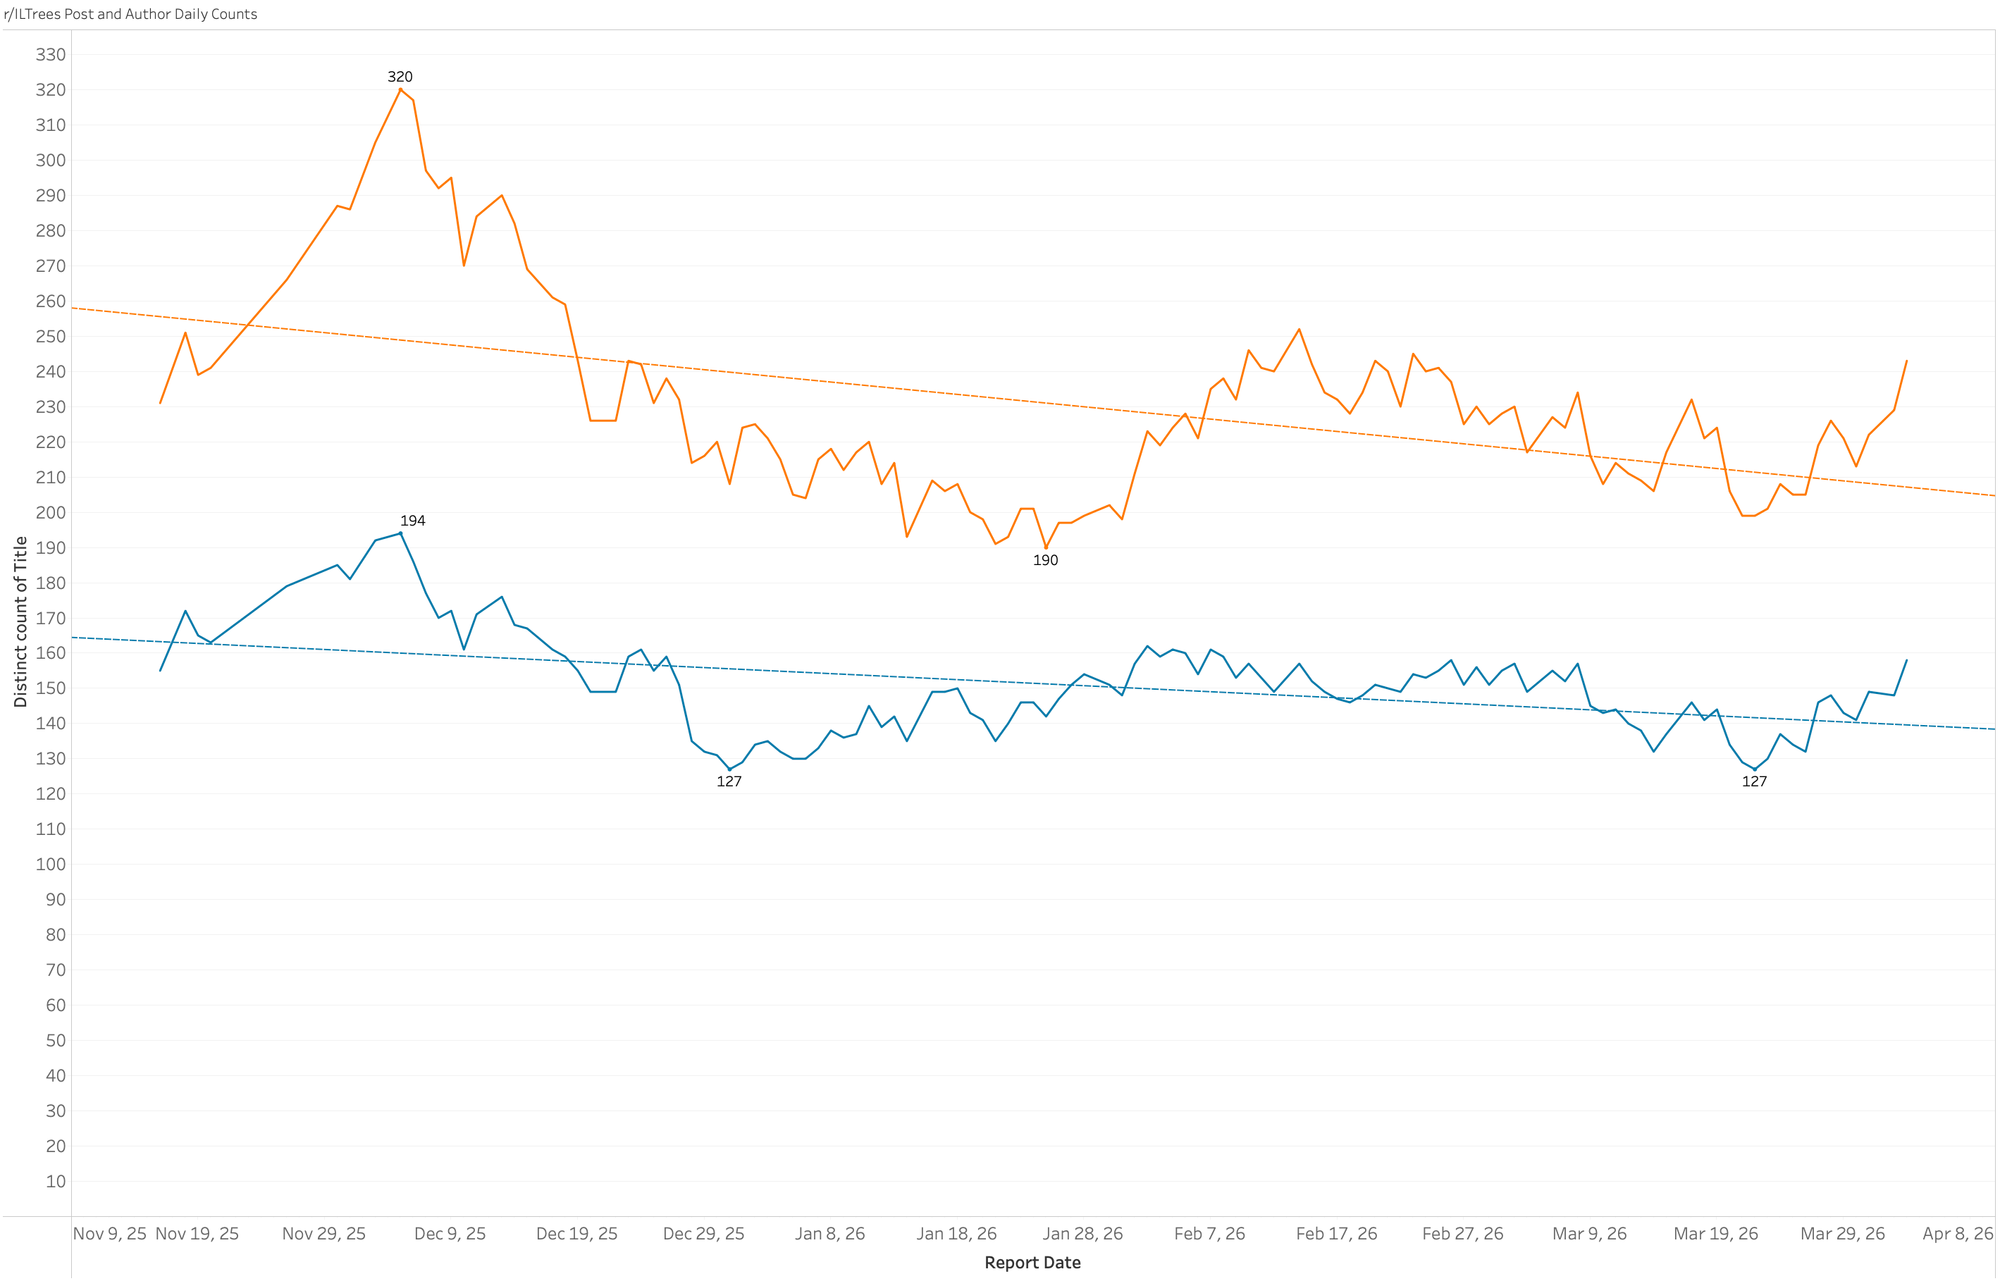
r/ILTrees (Illinois)
The Illinois community is the highest-volume segment in our U.S. sample, characterized by a highly active but volatile user base. Reaching a peak of 320 unique authors and 194 posts during the December surge, the subreddit saw a sharp contraction in mid-January, bottoming out at 130 unique authors. However, the data shows a robust "sawtooth" recovery throughout Q1 2026. Illinois maintains a strong post-per-author ratio, indicating that while fewer people may participate during off-peak times, those who remain are high-frequency contributors.
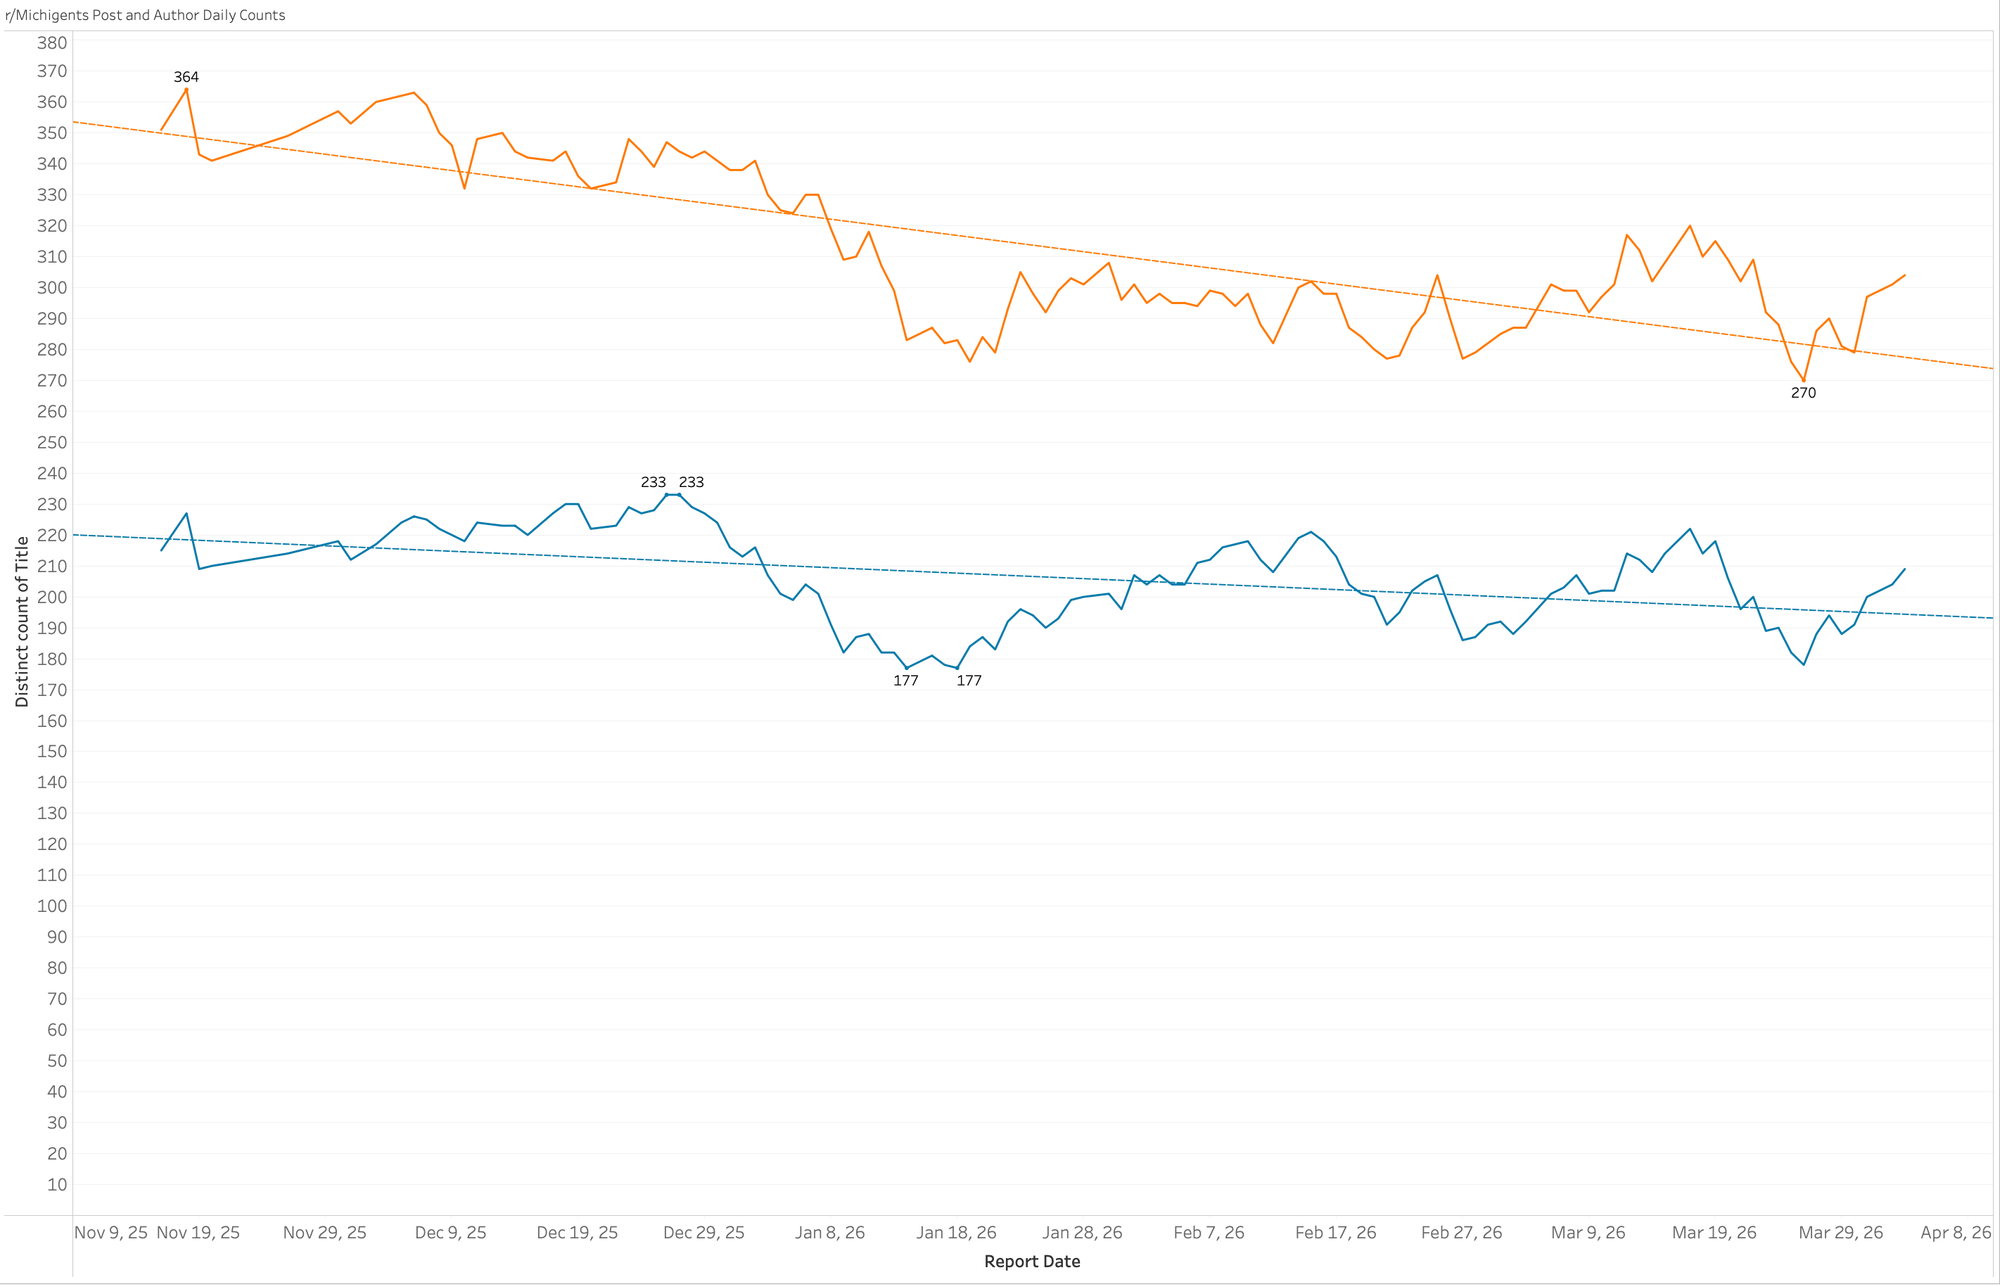
r/Michigents (Michigan)
In Michigan, the data reflects a community with the highest sustained engagement and user retention in the study. Peaking at 364 unique authors in late November, this subreddit consistently maintains a wide gap between authors and posts, suggesting a healthy, multi-participant dialogue rather than a few users dominating the feed. While the trend line shows a gradual downward slope from the November highs, the community has found a stable floor at the end of March, with author counts beginning to tick back up toward the 300 mark.
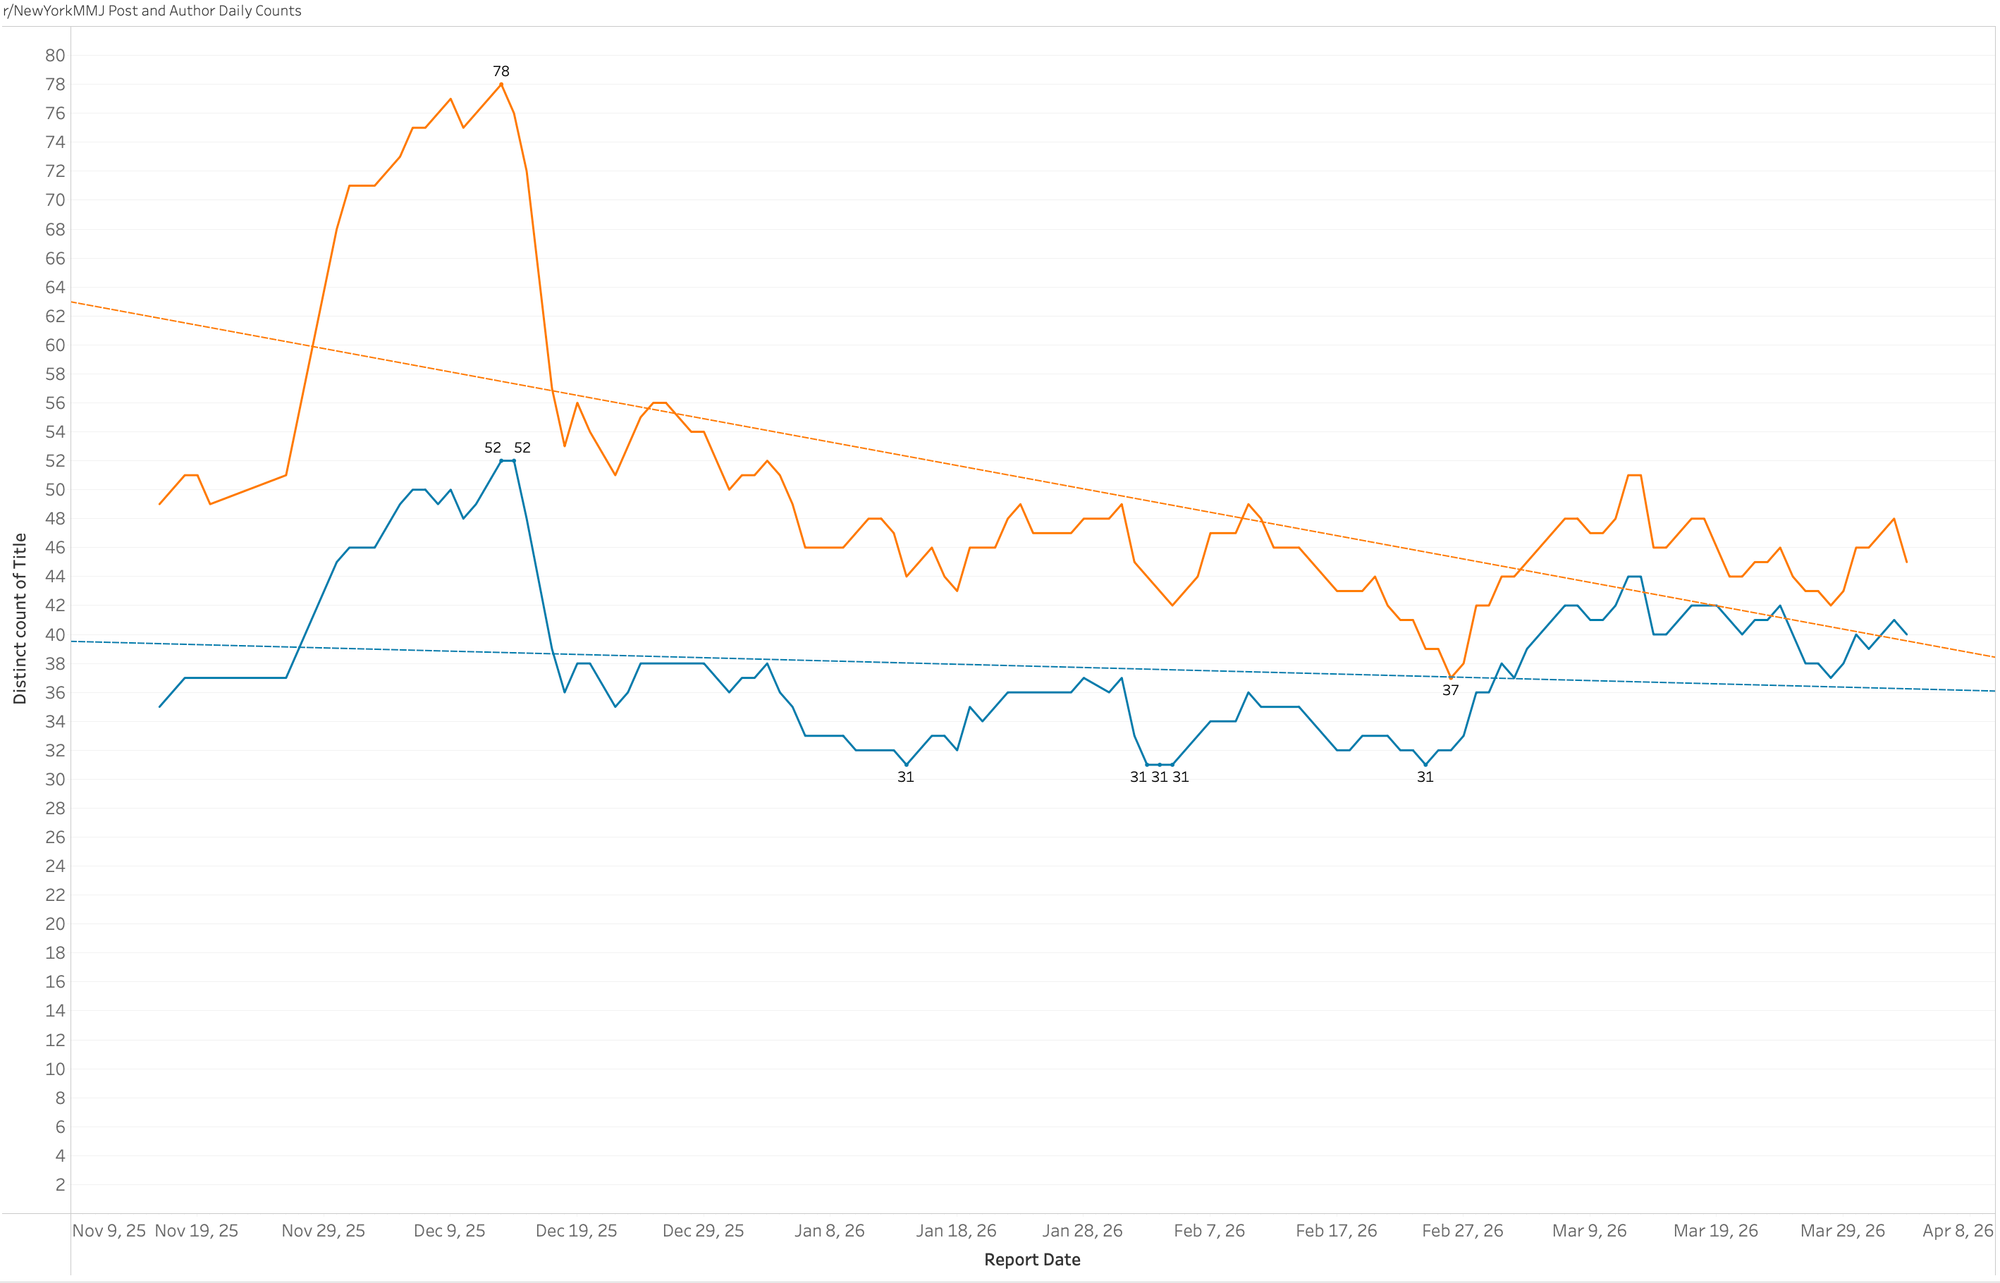
r/NewYorkMMJ (New York)
The New York medical community shows a distinct engagement pattern that is less reactive to holiday hype. The data peaked early in December with 78 unique authors, but hit several local floors of 31 unique authors throughout January and February. The lowest point occurred in late February with only 37 authors recorded. Despite these lower volumes, the overall trend line for r/NewYorkMMJ is currently showing a steady climb as we move into the second quarter of 2026, marking it as a resilient, specialized niche.
r/OKMarijuana (Oklahoma)
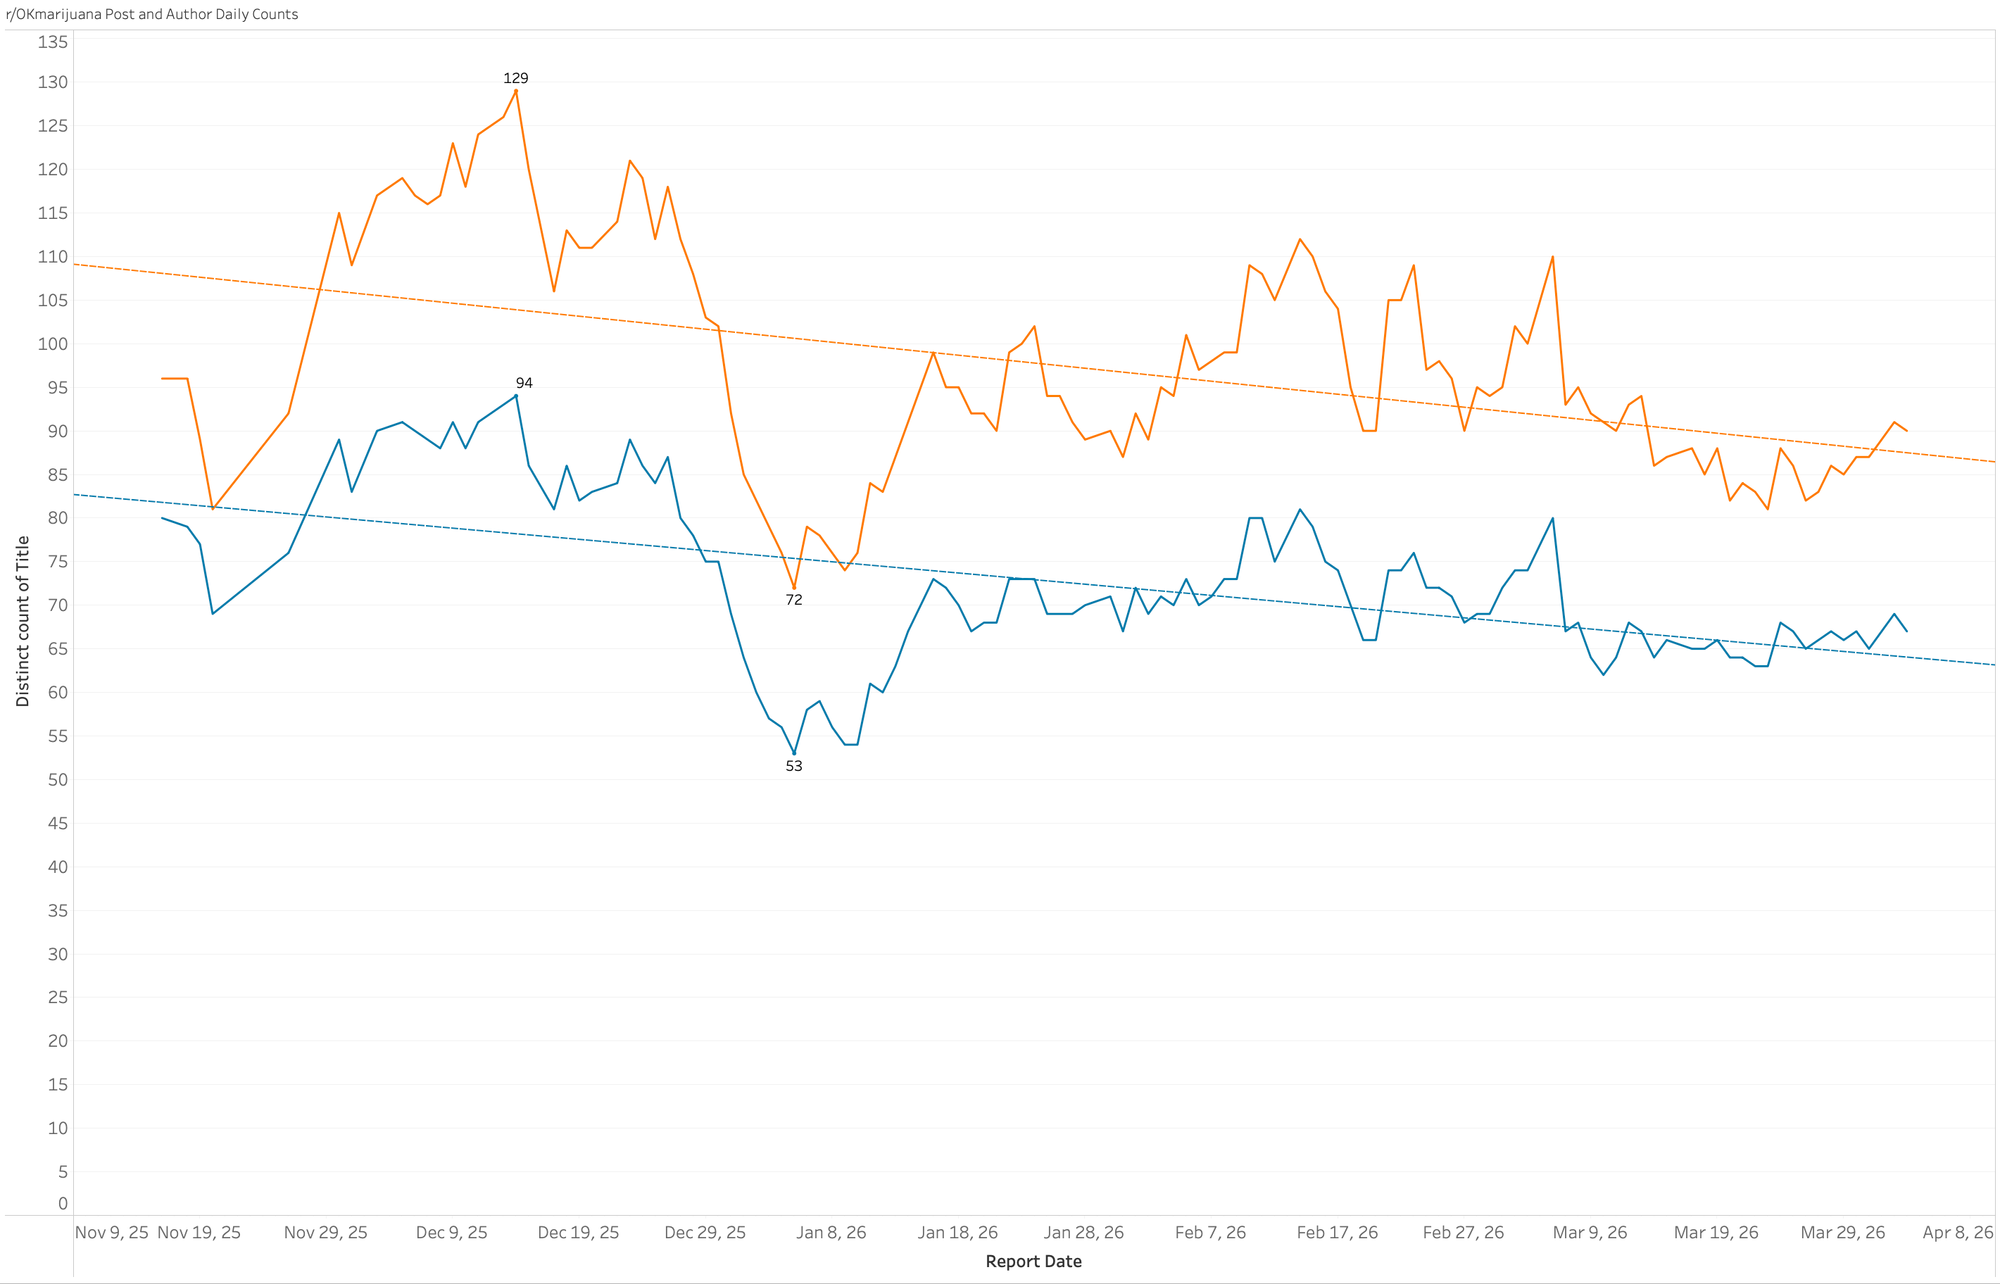
The Oklahoma market shows remarkable consistency. After an initial holiday peak of 129 unique authors and 94 posts, the community settled into a nearly horizontal trend line. While it hit a low of 53 unique authors in early January, the recovery was immediate. Throughout February and March, the subreddit has maintained a highly consistent daily output, suggesting a loyal core audience that is less influenced by the "hype cycles" or extreme seasonal fluctuations seen in coastal recreational markets.
r/COEnts (Colorado)
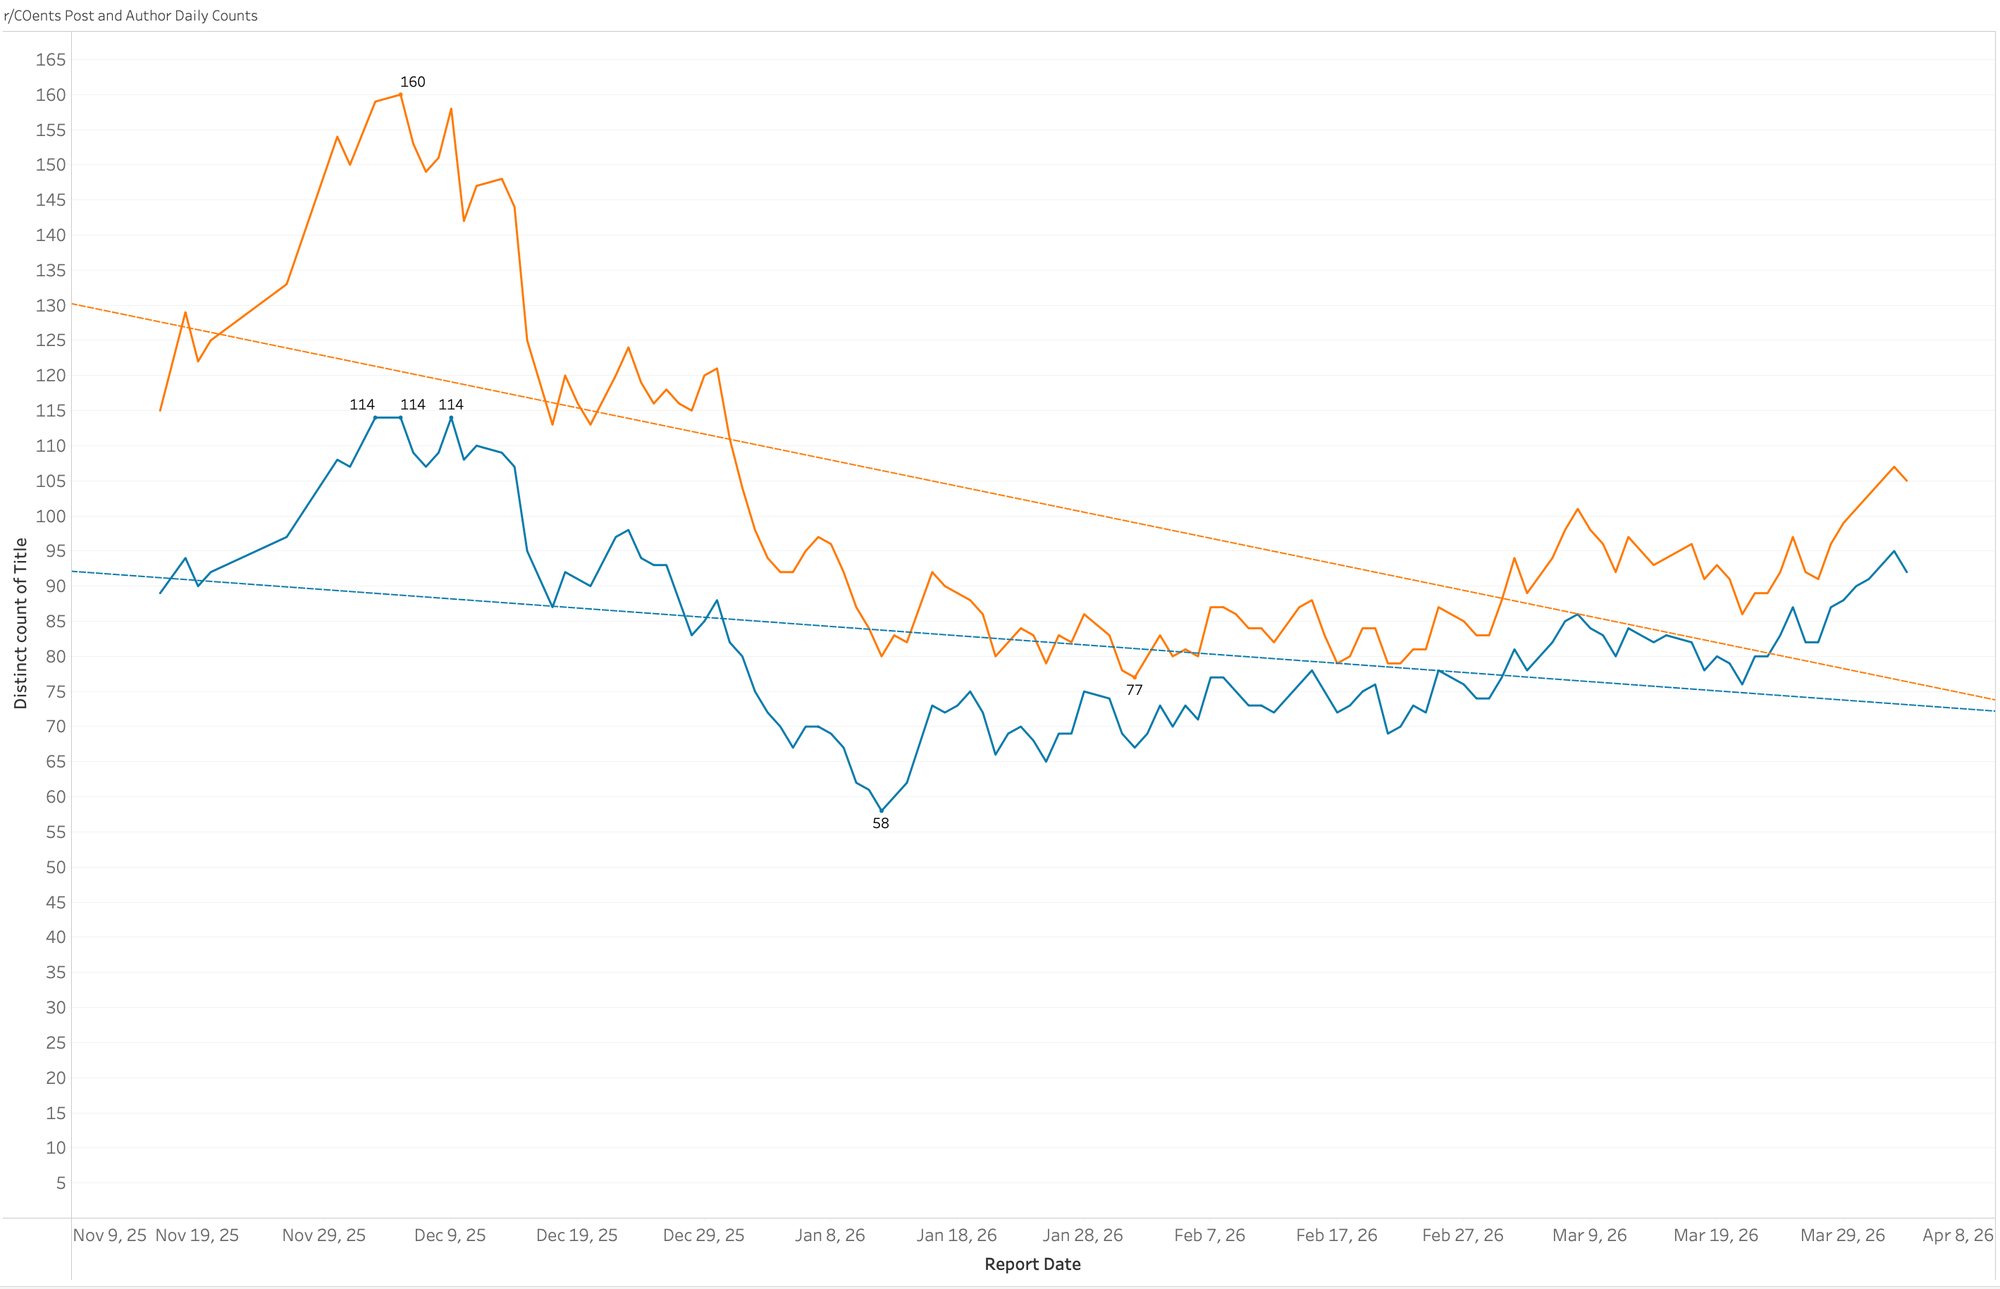
As a legacy market, Colorado displays a pattern of digital maturity with stabilized engagement. After hitting a period low of 58 unique authors in early January, r/COEnts has seen a slow but steady "spring awakening." The data shows author counts climbing back toward the 100+ mark by late March. This upward trend suggests that while the market is mature, the digital community remains highly active and capable of renewed growth as seasonal consumer interest increases.
r/BostonTrees (Massachusetts)
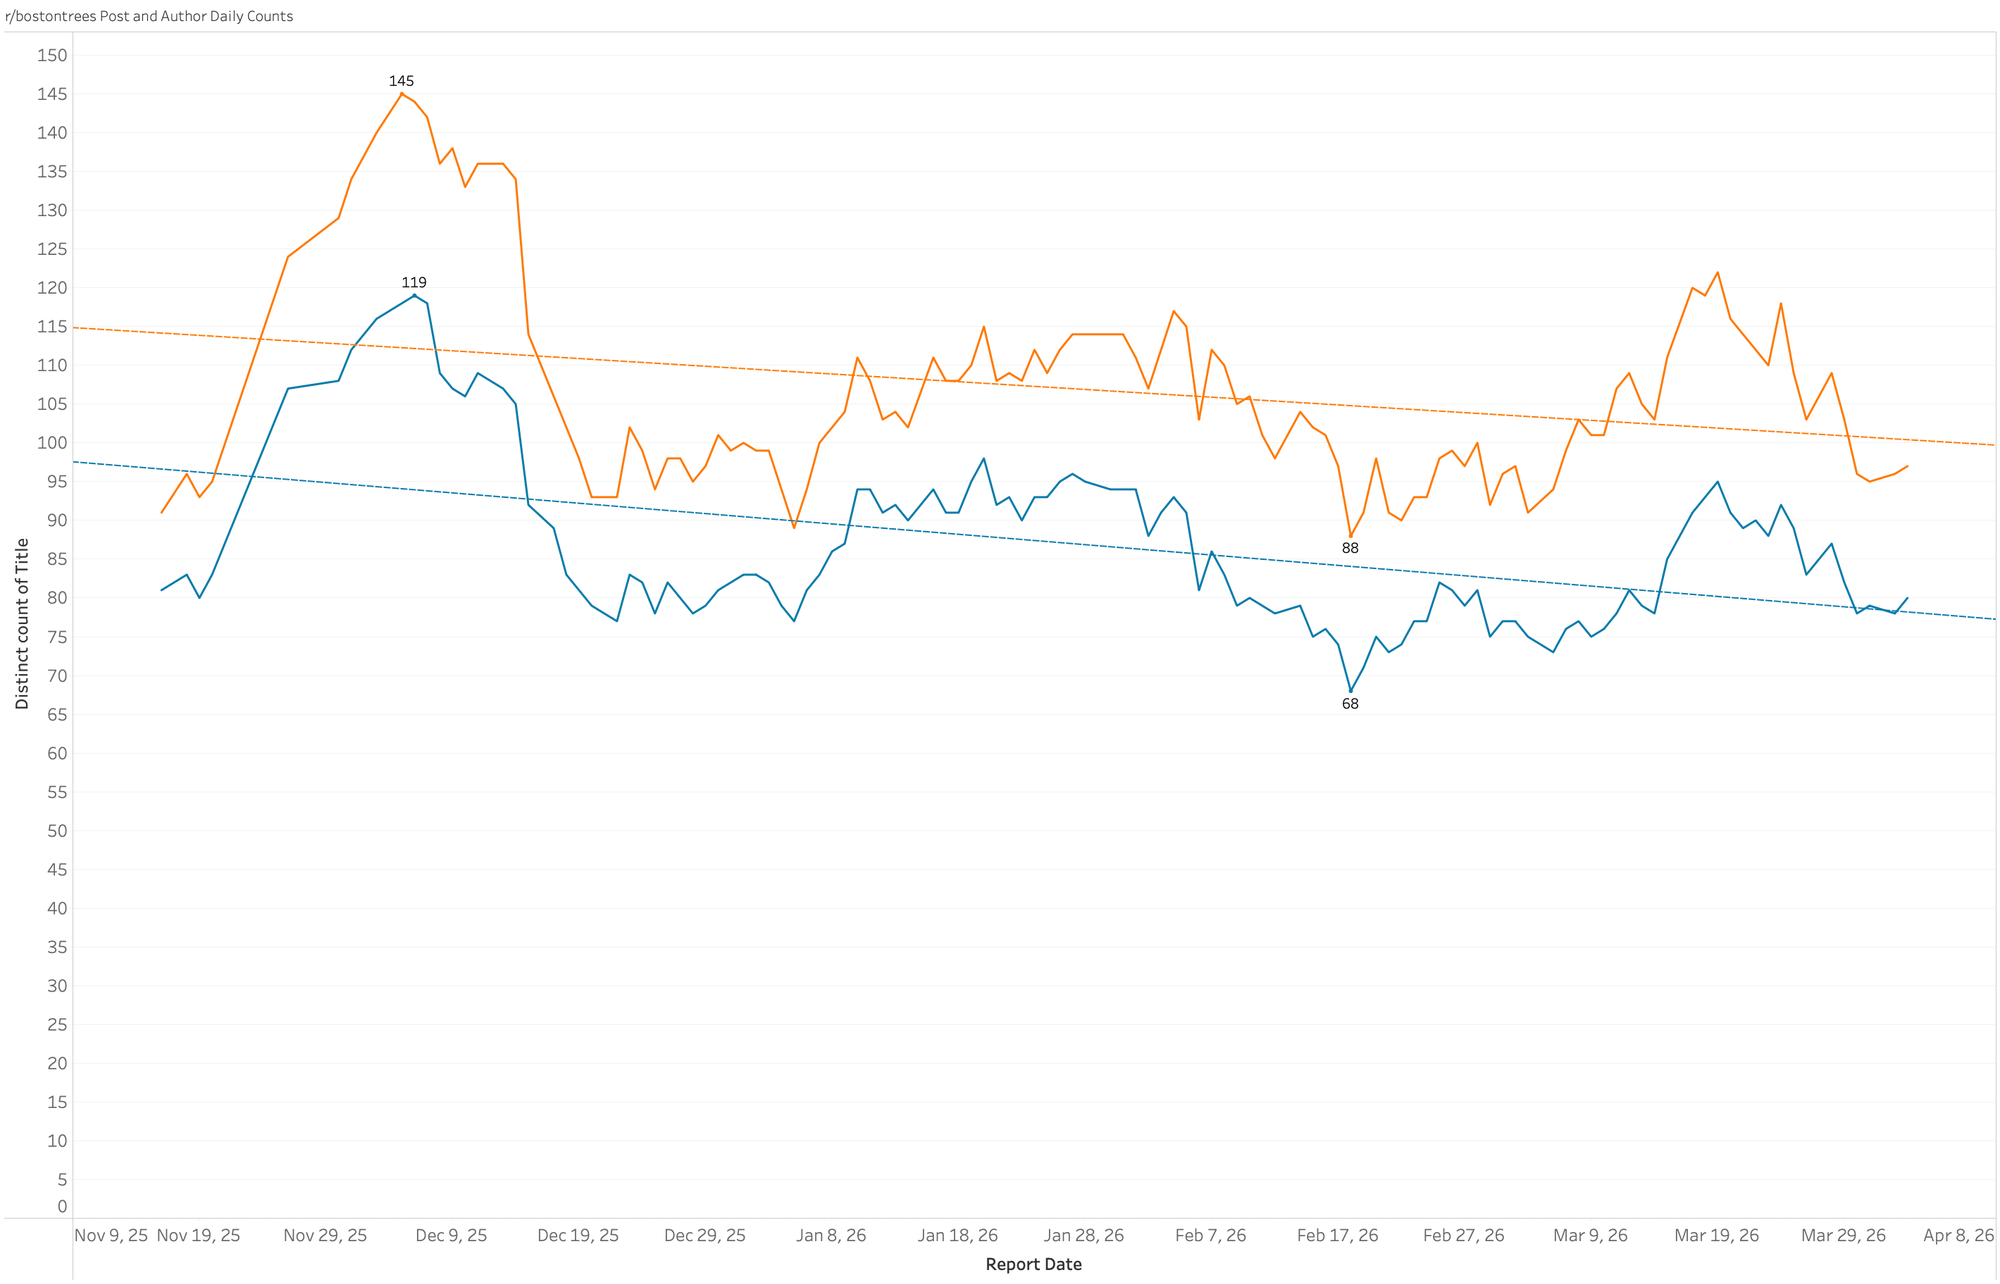
The Massachusetts community exhibits a more pronounced downward trend line over the six-month period. While r/BostonTrees saw a strong holiday performance with 145 unique authors and 119 posts, current engagement levels are approximately 30% lower than the Q4 2025 average. The data reached a significant low of 66 unique authors in mid-February. While there has been a minor recovery in March, the general slope remains negative compared to the Midwest subreddits.
r/WEnts (Washington)
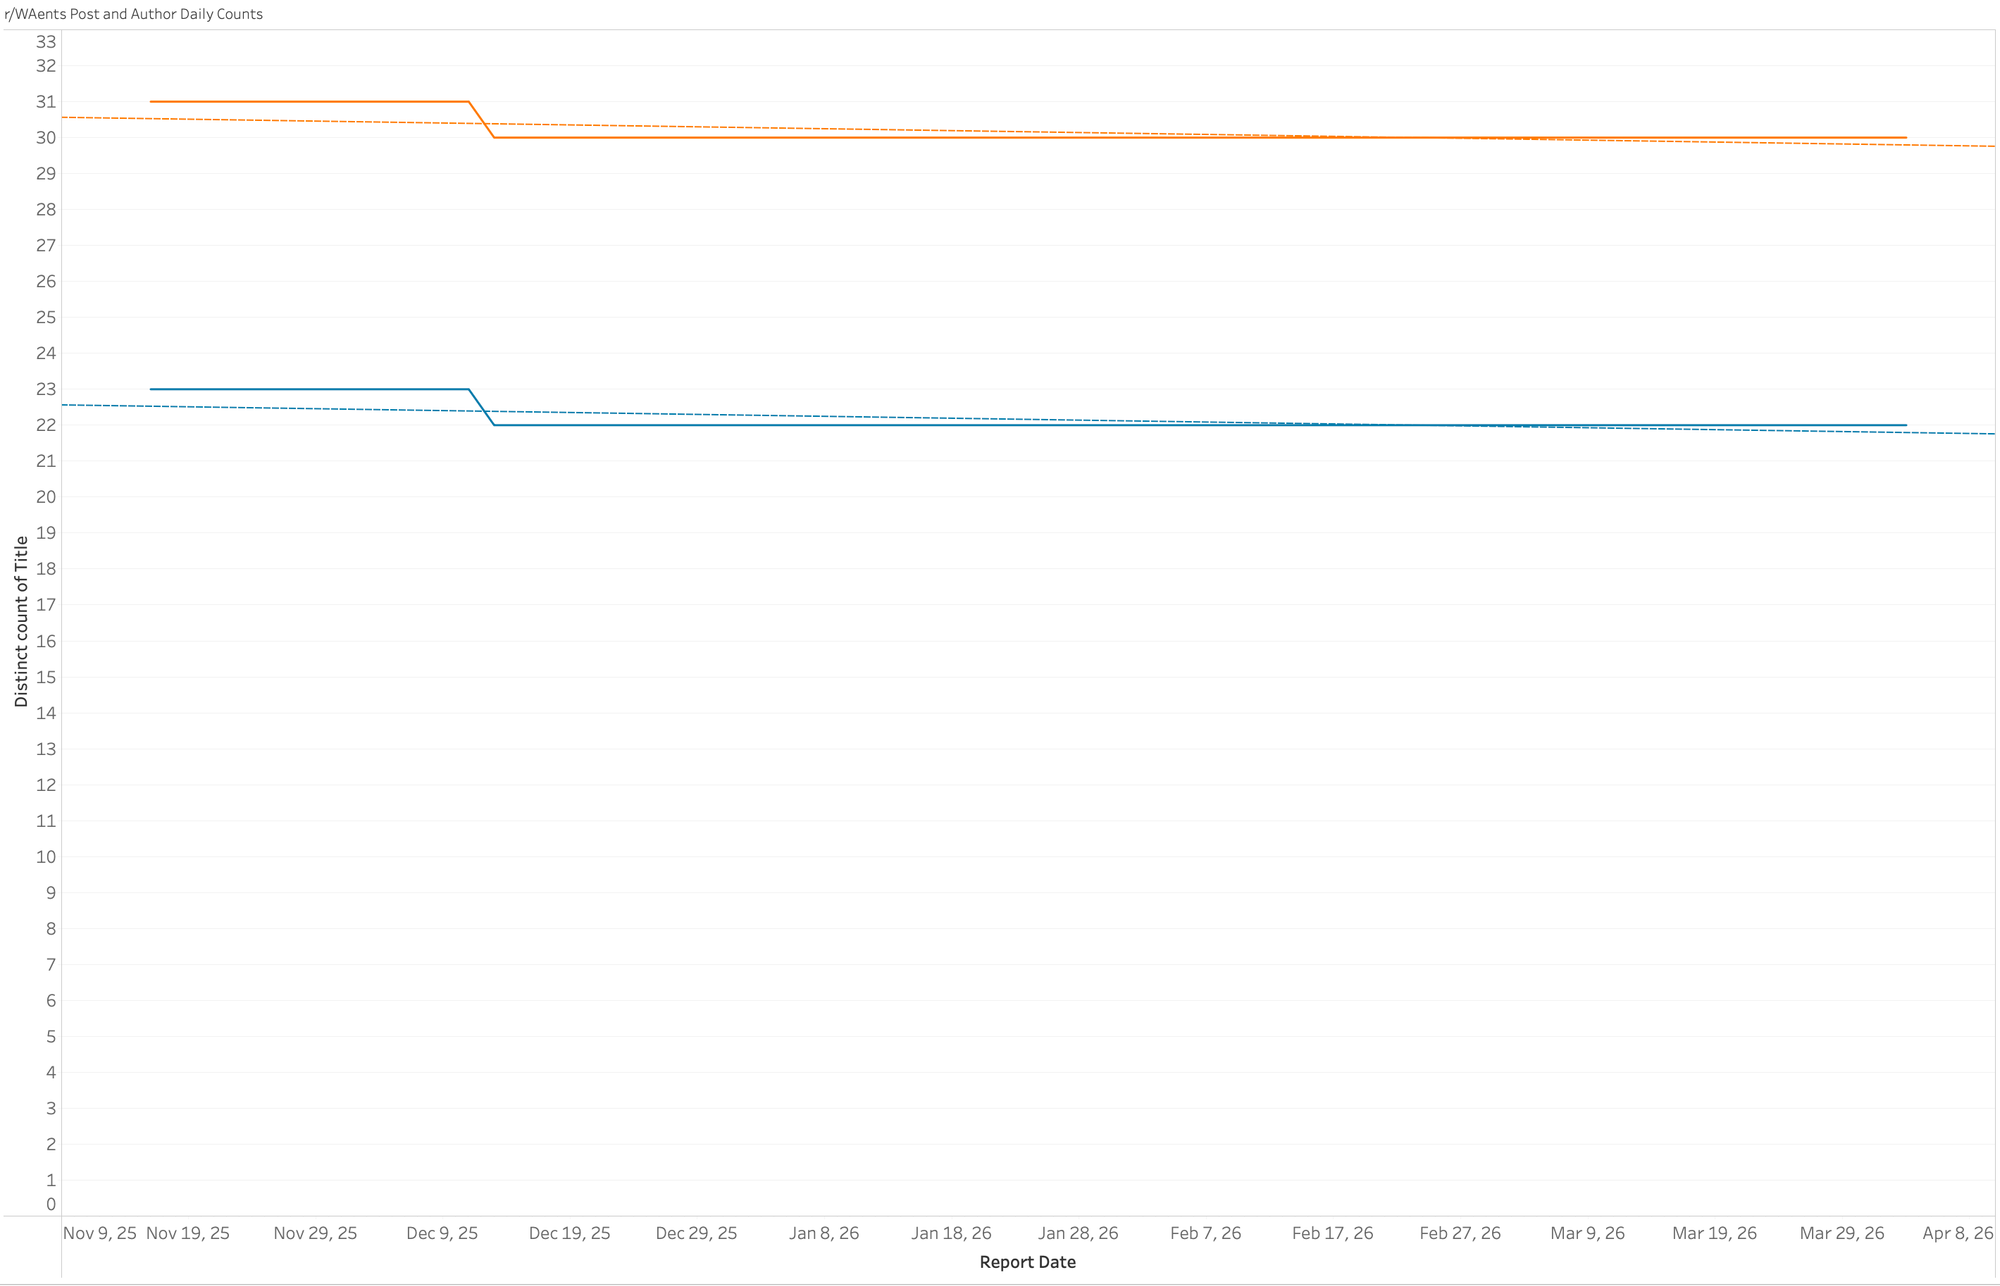
Washington presents the most static data set in our analysis, showing almost perfectly horizontal trend lines for both authors and posts. For the majority of the period, the community has hovered around 31 unique authors and 23 postswith very little deviation. This suggests a highly habitual, "circular" community with extremely high consistency and very little turnover. It represents the baseline for a mature, stable digital community where daily participation is fixed regardless of external market shifts.
Strategic Conclusion
From our perspective as a Canadian-based firm, this U.S. data suggests that digital cannabis discourse is highly sensitive to consumer behavior cycles, specifically holiday spending and subsequent "tolerance breaks." The V-shaped recovery observed in almost every jurisdiction following the January lows provides a predictable roadmap for engagement. For Bud Trendz, these comparisons confirm that the Midwest (Michigan and Illinois) remains the primary driver of digital volume. As we approach the 4/20 season, we anticipate a secondary surge in activity across all jurisdictions that may challenge the record highs seen in December.