Cannabis Reddit Trends June Report: Daily Scores and Sentiment Analysis
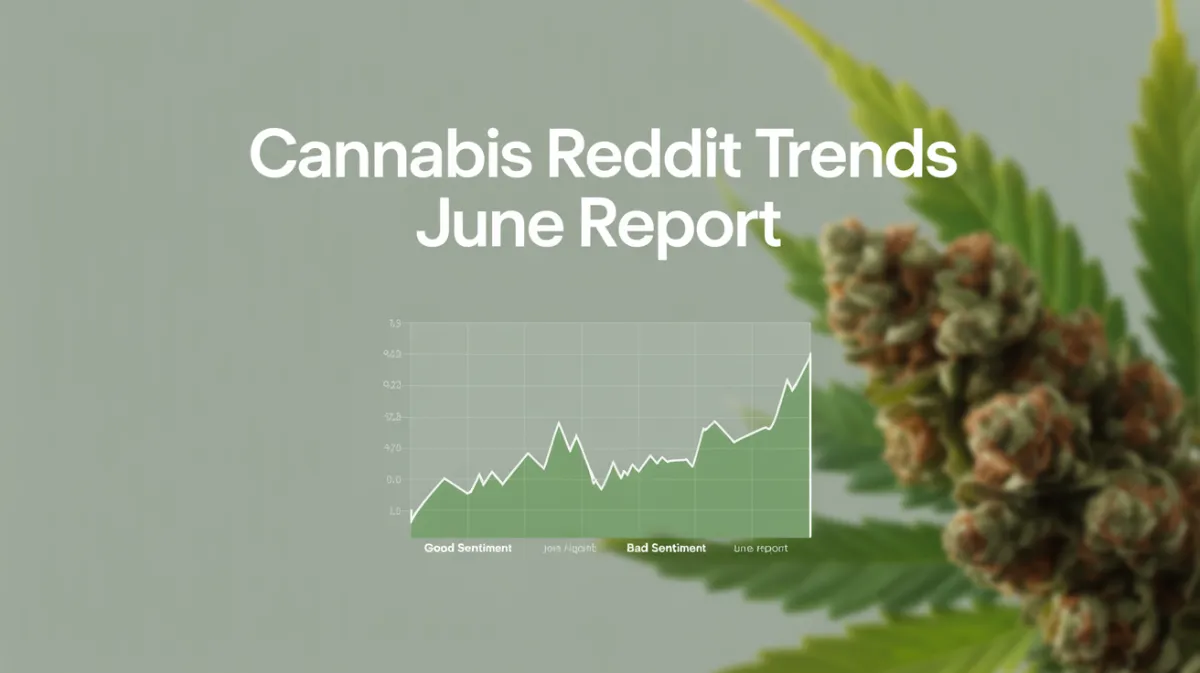
In this post, we analyze daily trend scores across all cannabis-related subreddits, focusing on average trend score by day, the sentiment bias of trending posts, and week-over-week changes. The trend score is a custom metric reflecting how much traction a post gains over time, weighted by upvotes, comments, and recency.
📊 Daily Average Trend Score: April–June 2025
Between April 1 and July 1, the average trend score per day showed clear fluctuations:
- Highest average: April 18 (16.04), likely buoyed by momentum leading into 4/20.
- Lowest average: June 1 (5.62), following a holiday dip in activity.
- Other notable highs included May 8 (15.19) and April 25 (15.75), suggesting days when popular posts went viral or multiple high-sentiment discussions occurred simultaneously.
- A sustained drop is seen across early June, bottoming out the first week before slowly recovering mid-month.
Here’s a look at the monthly averages:
- April: 12.68
- May: 12.18
- June: 10.38
This decline suggests some seasonal tapering in engagement, possibly due to summer distractions or fewer product launches.
😊 Sentiment Bias: Positive vs. Negative Trend Score
We segmented posts by sentiment—positive and negative—to compare how each group performed in terms of trend score.
🟢 Positive Sentiment:
- Maintained consistently higher scores.
- Peaked on June 4 at 16.29, showing an unusual bump despite the overall June dip.
- From April through June, positive posts scored ~3–5 points higher on average than overall daily averages, emphasizing that uplifting or favorable content tends to trend more.
🔴 Negative Sentiment:
- Highly volatile.
- Posts with negative sentiment occasionally trended extremely well, particularly in April and early May:
- April 25 (e.g. 43.36 avg trend score among negative posts)
- May 6–8 saw several spikes above 30, likely tied to controversial product reviews or bad retail experiences.
- Starting June, negative trend scores sharply declined, bottoming out near 3–5 in early June.
This gap in performance suggests that although negativity can trend, positive posts have broader, more sustained engagement, while negative ones trend more due to virality or conflict spikes.
🔁 Week-over-Week Trend Changes
From week to week, we observed:
- Strong upward movement in early May, particularly the week of May 5–11, where average scores climbed from the previous week’s ~12 to above 14.5.
- Sharp declines were recorded in early June (e.g., June 1–3 dipped to 6–8), possibly due to lower subreddit activity or fewer posts.
- A partial rebound started mid-June, with daily averages returning to 12–13 levels around June 18–19.
Overall, the second half of April and early May were peak trend periods, while early June marked a temporary lull. Late June is showing modest recovery.
🔍 Key Takeaways
- Positive sentiment trends better, with posts often scoring 2–5 points higher than the daily average.
- Negative sentiment posts can still trend high, but typically cluster around specific dates and often fade faster.
- Engagement dropped significantly in early June, possibly due to external seasonality factors or reduced post frequency.
- Trend scores appear to rebound mid-to-late June, suggesting activity could rise again in July.
Want more?
Check out our live dashboard to monitor Trend Score with a full breakdown of positive and negative sentiment.
Filter by subreddit, product type, or brand to see how your category or product is performing over time.
Get the insights you need to understand what’s resonating — and what’s not.