Who's Who in Canadian Cannabis Reviews: Q4 Top Reviewers

When examining reviewer performance over the past 90 days, we uncovered fascinating patterns in both total trend scores and average trend scores per product reviewed. The data reveals that quantity doesn't always correlate directly with impact.
New to the Series?
If you haven't read our first article examining review counts and posting frequency across Canadian cannabis communities, we recommend starting there for essential context. Our initial analysis breaks down how 468 unique authors contributed 1,356 reviews across six major cannabis subreddits during Q4 2024, revealing fascinating patterns about who's driving conversations in these communities.
Check out "Who's Who in Canadian Cannabis Reviews: Q4 2024 Analysis" here:

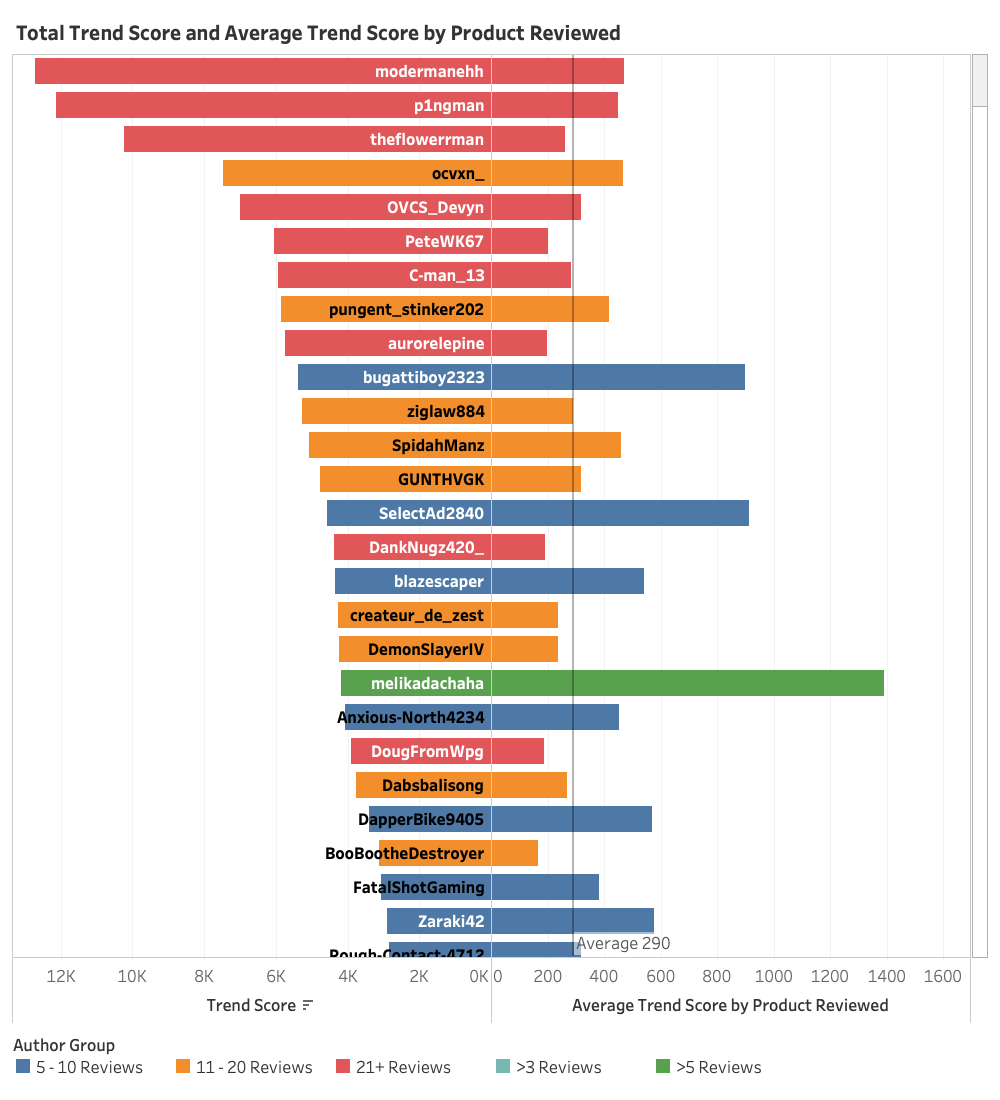
Among the most prolific reviewers (those with 21+ reviews), we see dominant performance in total trend scores, with modernmanehh leading the pack at nearly 13,000 points, followed closely by p1ngman, and theflowerrman in third place. This concentration of high trend scores among frequent reviewers suggests that consistent contributions often translates to higher cumulative impact.
However, the story becomes more nuanced when we look at effectiveness per review. The average trend score per product (indicated by the vertical line at 290) serves as a benchmark for reviewer impact over a single product. Several reviewers significantly exceeded this average, regardless of their review frequency. Notably, users like melikadachaha, SelectAd2840, and bugattiboy2323 demonstrated exceptional impact per review, with their averages extending well beyond the mean.
This analysis suggests that while frequent reviewers accumulate higher total trend scores, impactful reviews can come from contributors at any activity level. The data demonstrates that quality and influence aren't exclusively tied to quantity, as evidenced by several reviewers achieving outstanding average trend scores despite fewer total reviews.
Key Observations
Review Frequency Patterns:
• 21+ Reviews (Red, The Power Users): Dominates overall trend scores and consistently appears in top rankings
• 11-20 Reviews (Orange, The Core Contributors): Shows strong presence with regular top 10 appearances
• 5-10 Reviews (Blue, The Regular Reviewers): Demonstrates notable impact, regularly breaking into top 10
• <5 Reviews (Green, The Occasional Reviewers): While generally outside top 10 overall, makes significant appearances in negative sentiment rankings
Sentiment Distribution Impact:
• Consistent Excellence: p1ngman maintains a position in the top 5 across all sentiment categories (positive, neutral, and negative)
• Negative Review Impact: Despite being less common, negative reviews achieve the highest average trend score (305)
• Total Score Context: While negative reviews show high per-post impact, their lower frequency results in smaller total trend scores
Frequency vs. Impact Relationship:
• High-Frequency Leaders: Most frequent reviewers (21+ reviews) accumulate the highest total trend scores
• Mid-Frequency Success: Contributors posting 5-10 reviews regularly achieve top 10 positions
• Low-Frequency Influence: While reviewers posting <5 reviews typically fall outside the overall top 10, they show significant presence in negative sentiment rankings.
Positive Sentiment Analysis: The Dominant Voice in Product Reviews
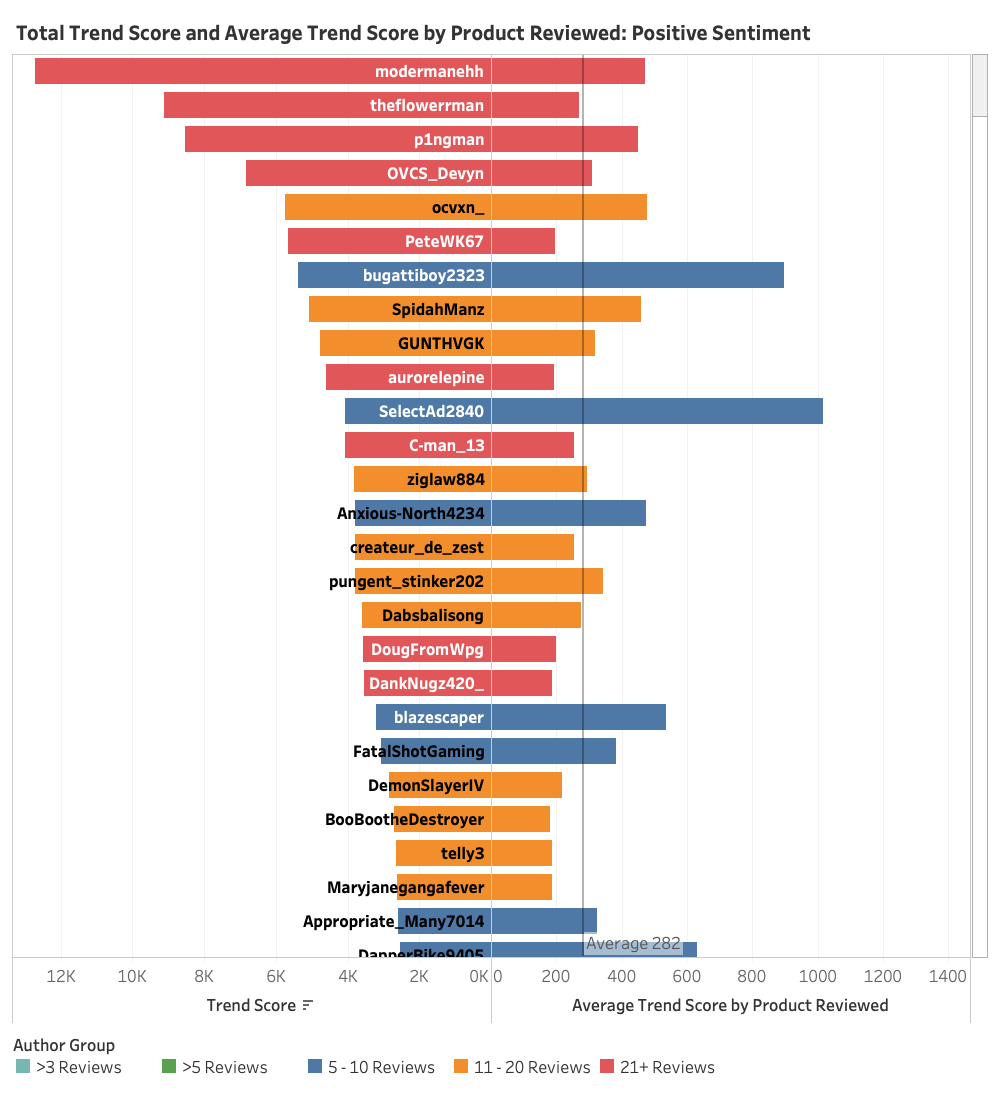
When we filter our trend score analysis to focus solely on positive sentiment reviews, which comprise a substantial 83% of all reviews in our 90-day period, we observe patterns that largely mirror our overall analysis, with some notable nuances.
The upper echelon of trend scores remains consistently dominated by our most frequent reviewers, with modernmanehh, theflowerrman, and p1ngman maintaining their strong positions. This stability in the rankings suggests that these prolific reviewers tend to approach their reviews with a predominantly positive perspective, which aligns with the general nature of product reviews - users typically purchase items with positive expectations and share their satisfactory experiences.
The average trend score for positive reviews (282) serves as a benchmark that closely tracks with our overall average, reinforcing that positive sentiment drives the majority of review engagement. High-impact reviewers like bugattiboy2323 and SelectAd2840 continue to demonstrate exceptional per-review performance even when isolating positive sentiment.
This predominance of positive reviews (83%) provides important context for our analysis, suggesting that while reviewers maintain their critical faculties, they generally approach products with an optimistic outlook. This sets up an interesting framework for examining the remaining 17% of reviews split between neutral and negative sentiments, which we'll explore next.
The consistency between this positive sentiment analysis and our overall trend scores indicates that success in product reviewing isn't just about frequency or positivity in isolation, but rather about providing valuable insights regardless of sentiment orientation.
Neutral Sentiment Analysis: A Different Pattern Emerges
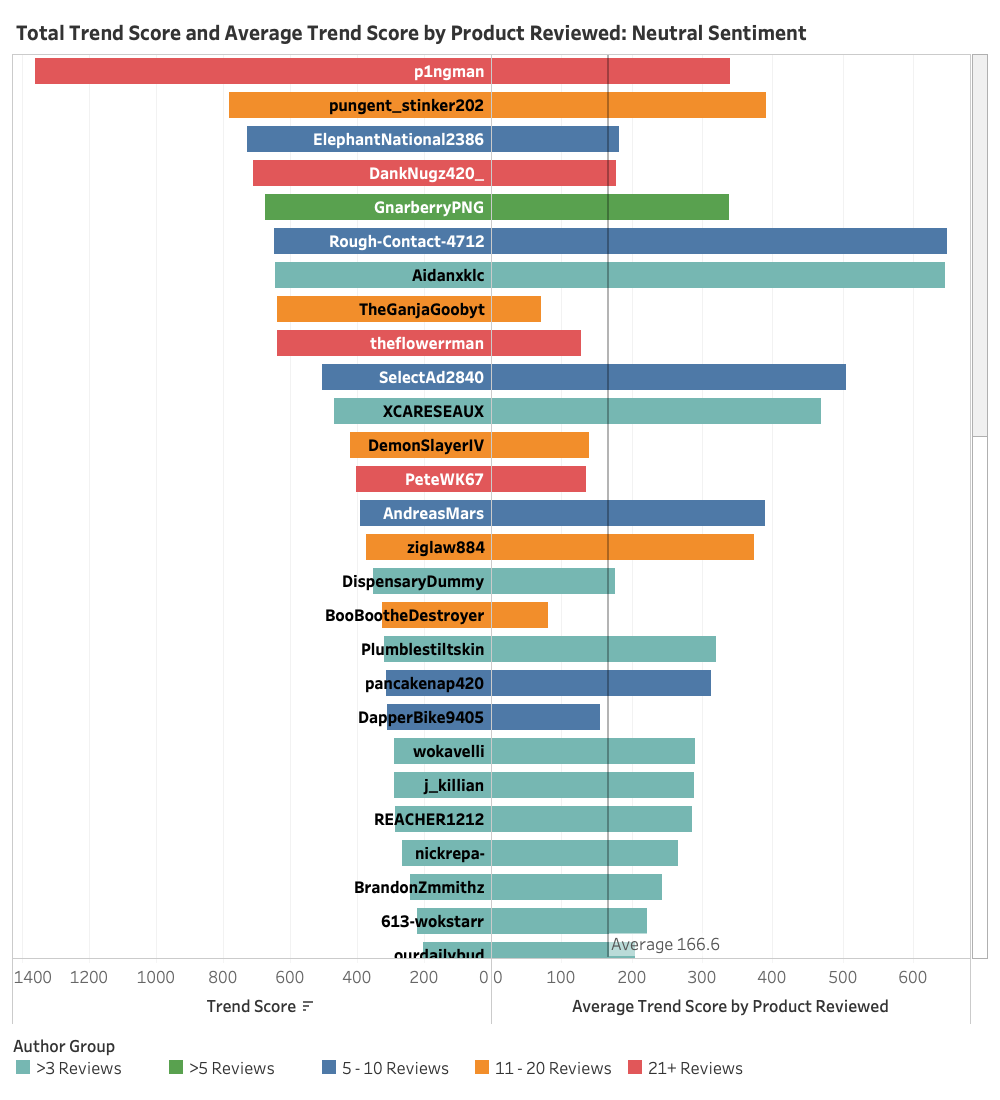
Shifting our focus to neutral sentiment reviews, which represent just 6% of the total data, we observe a notably different distribution pattern from our positive sentiment analysis. This smaller but significant segment reveals interesting insights about reviewer behavior and impact.
While p1ngman maintains a leading position in trend scores among frequent reviewers (21+ reviews), one of the most striking differences in this neutral sentiment analysis is the increased presence of less frequent reviewers. The graph shows a substantial representation of contributors who post fewer than two reviews over the 90-day period (indicated in turquoise), suggesting that occasional reviewers are more likely to express neutral viewpoints.
Familiar names like theflowerrman appear in this neutral sentiment category as well, which adds credibility to their overall review portfolio. This balanced approach to reviewing - including neutral perspectives alongside positive ones - suggests a more nuanced and authentic evaluation style. It indicates that these reviewers aren't simply offering blanket praise but are providing measured, objective assessments when warranted.
The average trend score for neutral reviews (166.6) is notably lower than the positive sentiment average, reflecting different engagement patterns with neutral content. However, several reviewers significantly exceed this benchmark, with standout performances from contributors like Rough-Contact-4712 and SelectAd2840.
This distribution pattern suggests that while neutral reviews are less common, they play an important role in establishing reviewer credibility and providing balanced product assessments. The presence of both frequent and infrequent reviewers in this category indicates that thoughtful, measured feedback can come from contributors at any activity level.
Negative Sentiment Analysis: Infrequent Reviewers Take Center Stage
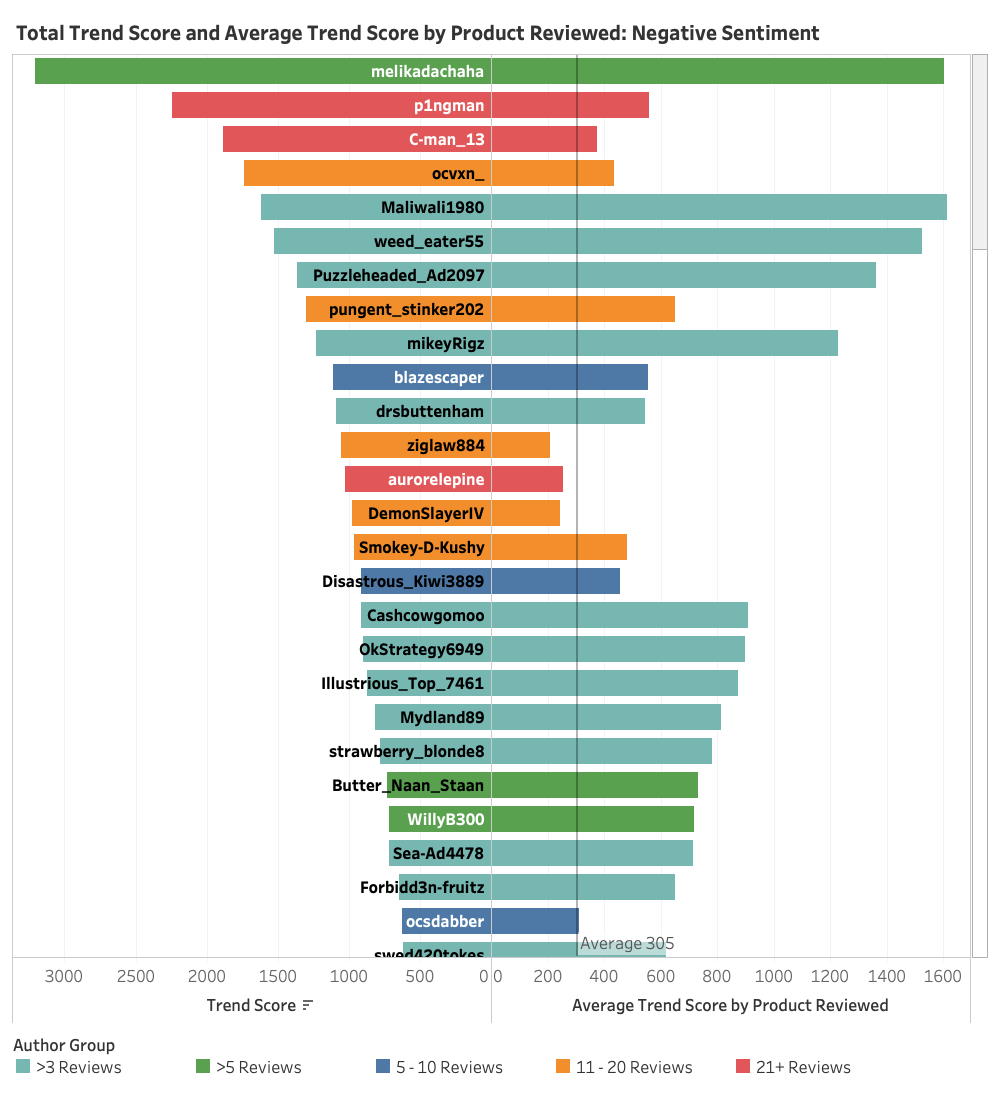
In examining the negative sentiment reviews, which represent the smallest segment of our data, we uncover a distinctly different pattern of contributor behavior. Most notably, the distribution shifts dramatically toward infrequent reviewers, with authors posting fewer than three reviews during the 90-day period claiming many of the top positions.
Leading this category is melikadachaha, followed by p1ngman and C-man_13. While p1ngman (21+ reviews) and ocvxn_ (11-20 reviews) maintain strong positions, they are exceptions to the general trend. The prevalence of infrequent reviewers at the top of this list suggests that negative reviews often come from users who feel compelled to share specifically disappointing experiences rather than from regular reviewers.
Particularly interesting is the average trend score for negative reviews at 305, which surpasses both positive (282) and neutral (166.6) sentiment averages. This higher engagement rate with negative content might indicate that the community places particular value on well-articulated critical feedback, perhaps viewing it as especially helpful for making informed purchasing decisions.
The distribution pattern reveals that while our most active reviewers maintain a presence across all sentiment categories, negative reviews are more likely to originate from occasional contributors. This could suggest that negative experiences are often the primary motivator for less frequent reviewers to share their thoughts.
This concludes our sentiment analysis across positive, neutral, and negative reviews.
Next, we'll explore specific top-performing posts within various subreddits, connecting these trend patterns to actual content from our most impactful reviewers.


